mptcptrace demo, experiment four
This is the fourth post of a series of five. Context is presented in the first post. The second post is here. The third post is here.
Fourth experiment
| Green at 0s: |
|
|---|---|
| Green at 5s: |
|
| Green at 15s: |
|
| Red at 0: |
|
| Red at 15: |
|
| Client: |
|
In this fourth experiment, we change the loss rate of the red path to 1% after 15 seconds.
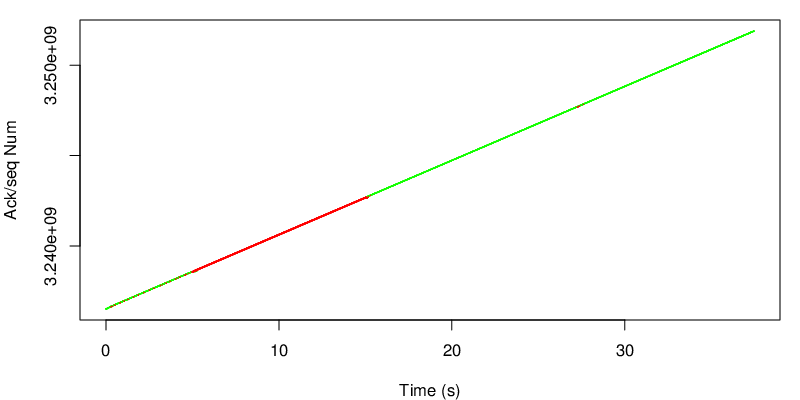
Again we take a look at the evolution of the sequence number.
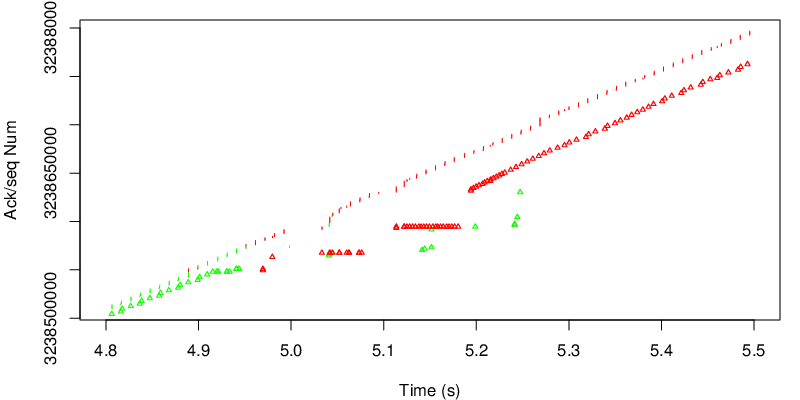
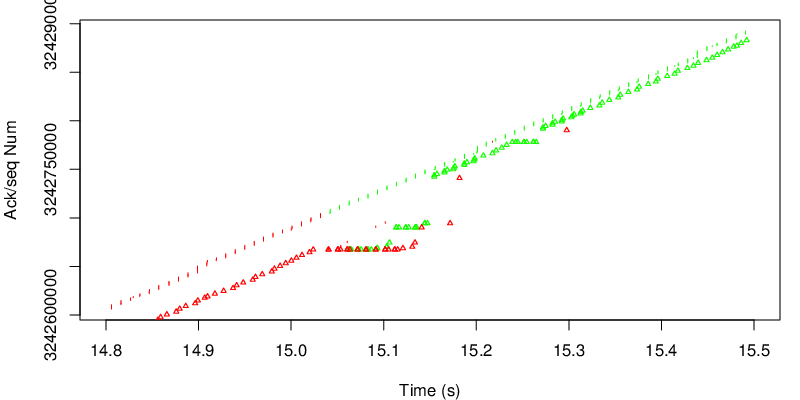
In this case however we can see the shift after 15 seconds. Because the red link become lossy after 15 seconds, the congestion window of the red subflow shrinks and MPTCP needs to send data again on the green subflow if the congestion window of the red subflow becomes too small to sustain the application rate. Because MPTCP now sends a little bit of traffic on the green subflow, it realises that the green subflow has changed and has now a lower delay and a lower loss rate. As a consequence the green subflow will open the congestion window again and will have a large enough congestion window to sustain the application rate.
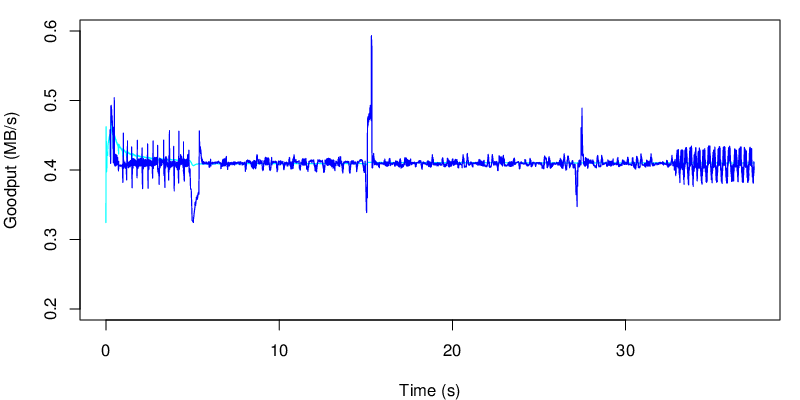
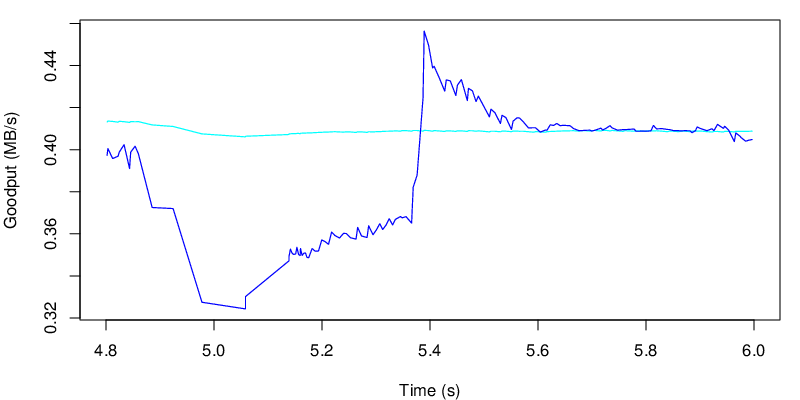
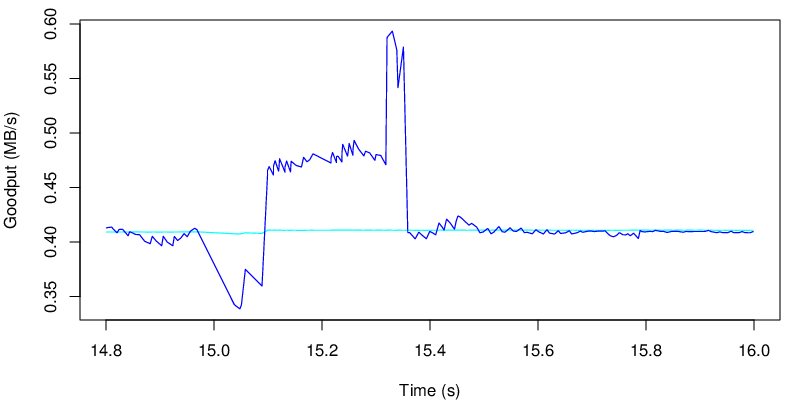
If we take a look at the evolution of the goodput, we see the two shifts at 5s and at 15s
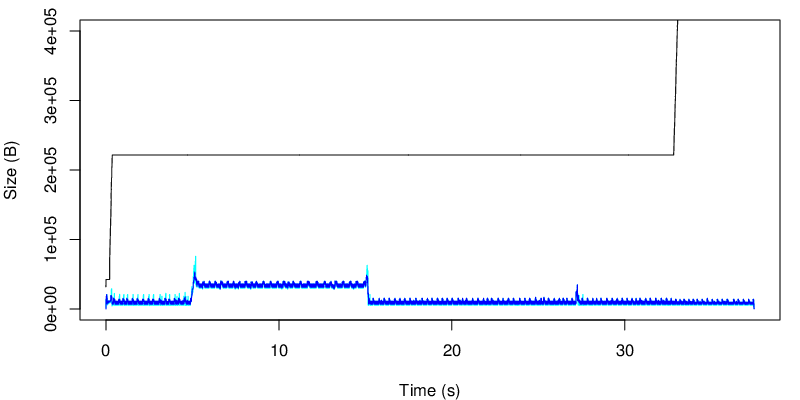
The evolution of the MTPCP unacked data is shown below :
We can see the change after 15s and that we use less of the receiver window after 15 seconds… In this case, because the red link is lossy, we consume less of the receive window. In our case the receive window is big enough anyway, but we would have different results if the window were smaller. We could reduce the window size by reducing the rmem but this for an other experiment.
Again we can look at the evolution of the unacked data at the TCP level
again we observe the shift after 15 seconds.
